Calculates neutron and X-ray reflectivity scattering length density (SLD) profiles from user supplied structures.
The SLD MOL module is accessible from the Calculate section of the main menu.
The purpose of the module is to calculate theoretical neutron and X-ray reflectivity SLD profiles, SLD(z) vs z, from user supplied structures for comparison to experimentally-derived SLD profiles. Utilities for experimental planning and isotopic labeling as well as optimization of ensemble populations are supplied.
The default input file format for the user supplied structures is DCD. Multi-frame PDB files are also allowed.
Even if only one structure is to be used to calculate a theoretical SLD profile, it still needs a reference structure even if the coordinates are in PDB format.
The user supplied structures must have residue fields at a minimum. Residue naming must be compatible with those defined in the CHARMM force field.
Two modes of operation can be chosen:
In both cases, the intial (anchor) z position, z0, and the fractional surface coverage, A0, can be optimized by minimizing the chi-squared value between the experimental and calculated SLD profiles. The z-axis of the experimental SLD profile can be offset prior to optimization.
The recommended workflow for examining the SLD profiles for an ensemble of structures is to first optimize z0 and A0 for the average SLD profile. Then, calculate the individual SLD profiles for each structure in the ensemble using those optimized z0 and A0 values.
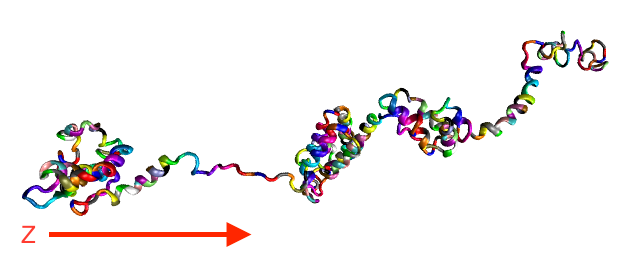
These examples calculate SLD profiles from an ensemble of structures of the HIV1 gag protein on a surface, optimizing z0 and A0 of the average SLD by comparing to an experimentally-derived SLD profile. One such structure is shown below. The surface would be at the left side of the frame.
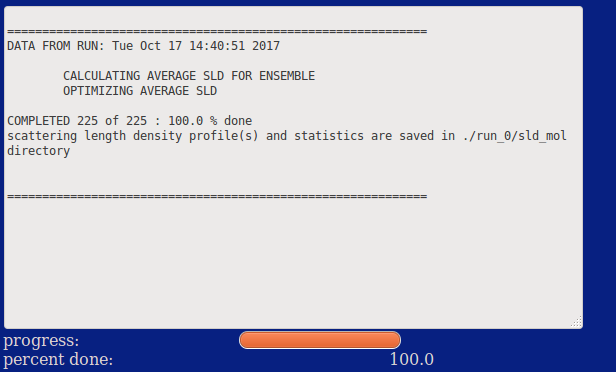
NOTE: The ensemble used in these examples contains 225 structures. Typically, more than 10,000 structures are required to adequately sample the possible conformations that can occur at a surface. Some conformations may need to be excluded due to packing effects at the surface, experimentally determined Rg value, etc. A number of ensembles may need to be tested before a suitable result that matches the experimental data is obtained.

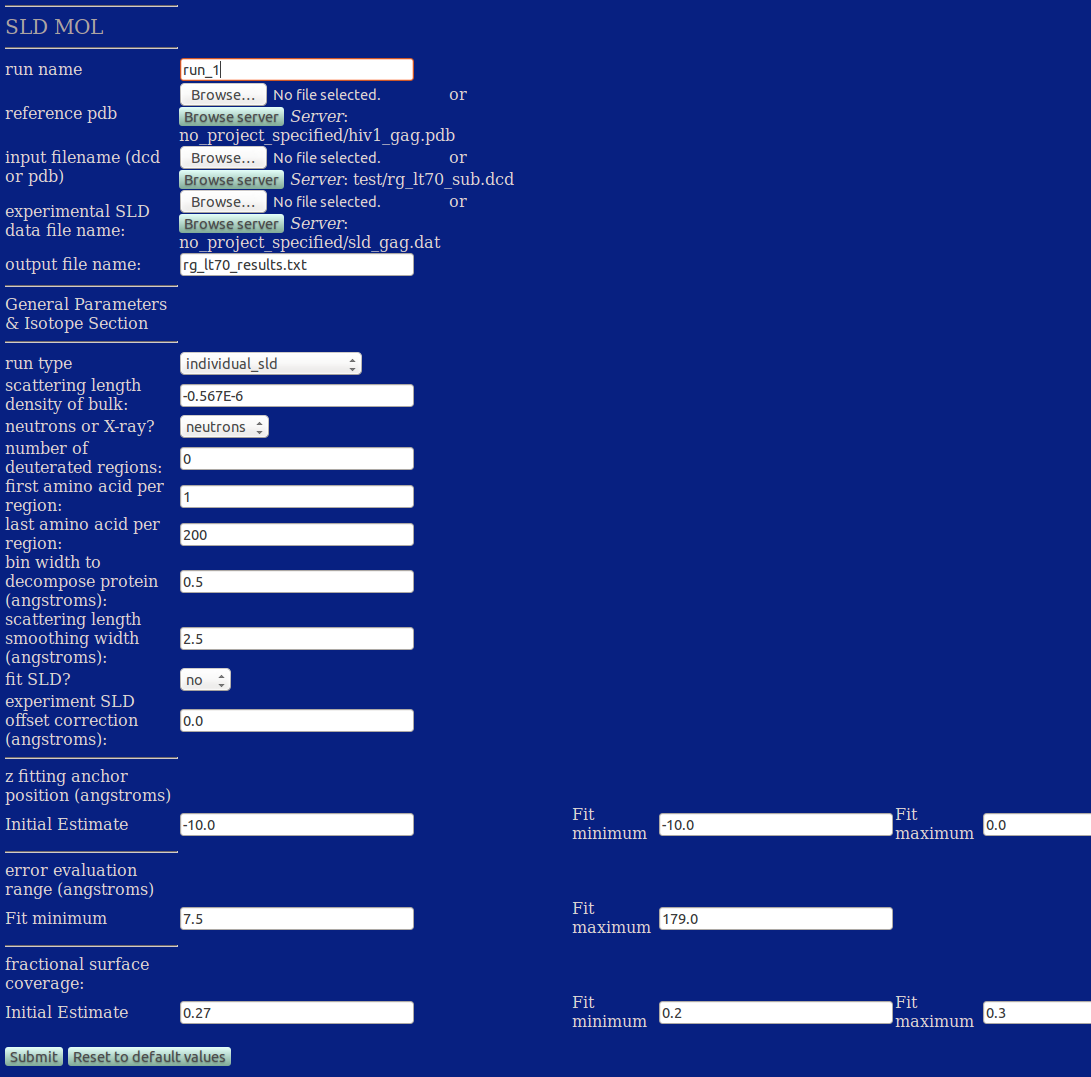
run name User defined name of folder that will contain the results.
reference pdb PDB file containing initial coordinates. Select from local computer or from server.
input filename (dcd or pdb) DCD or PDB file containing the coordinates for calculation of SLD profiles.
experimental SLD data file name File containing the experimental SLD profile
outout file name Output file that will contain the z0, A0 and chi-squared values of the calculated SLD profiles.
General Parameters & Isotope Section
z fitting anchor position (angstroms)
error evaluation range (angstroms)
If experimental SLD offset correction is non-zero, Fit minimum and Fit Maximum must be adjusted to include the z-offset value.
fractional surface coverage
./run_0/sld_mol/average_sld.txt
./run_0/sld_mol/rg_lt70_results.txt
average_sld.txt contains the average SLD profile of the ensemble.
rg_lt70_results.txt contains the z0, A0 and chi-squared values for the average SLD profile.
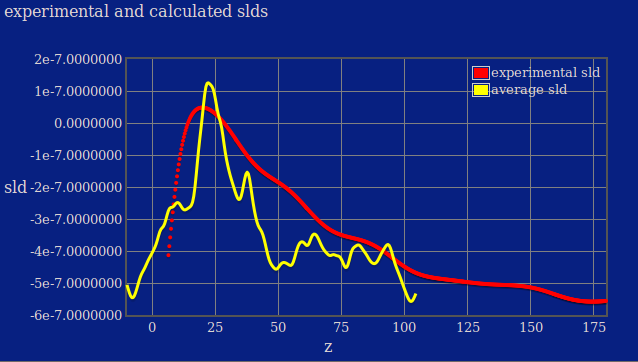
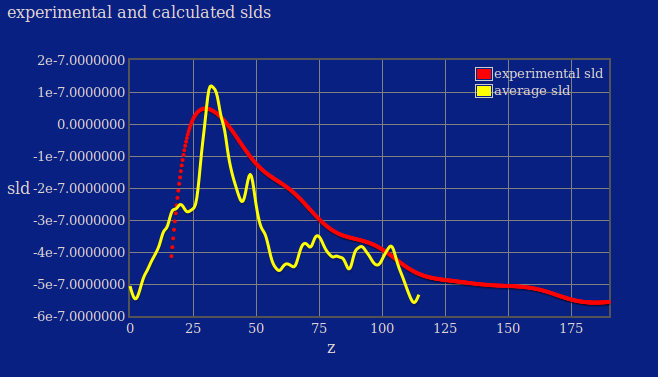
Plot of experimental SLD and optimized average SLD. Recall that there are only 225 structures in this test ensemble. A better match to the experimental SLD can likely be obtained with a larger starting ensemble.
input files
output files
An examination of the rg_lt70_results.txt file created in the above example shows the optimzed z0 and A0 values for the average SLD.

This example now calculates the individual SLDs using the optimzed values: z0 = -10.0 and A0 = 0.27.
General Parameters & Isotope Section
run type Select average_structural_sld (fast) or individual_sld (slower). Individual_sld is selected here.
fit SLD? Yes to optimize z0 and A0; No to use initial estimates with no optimization. No is selected here.
z fitting anchor position (angstroms)
error evaluation range (angstroms)
fractional surface coverage
./run_1/sld_mol/average_sld.txt
./run_1/sld_mol/rg_lt70_results.txt
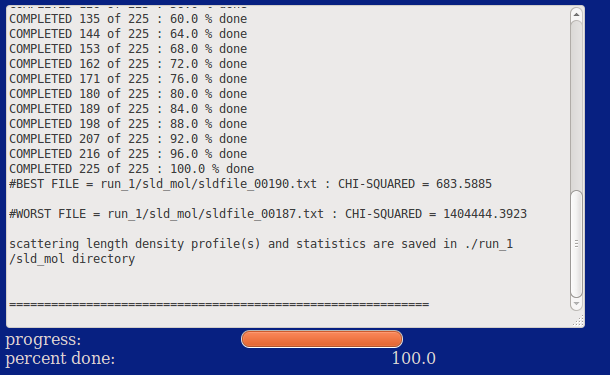
./run_1/sld_mol/bestworstfile.txt
./run_1/sld_mol/sldfile_00001.txt
.
.
.
./run_1/sld_mol/sldfile_00225.txtaverage_sld.txt contains the average SLD profile of the ensemble.
rg_lt70_results.txt contains the z0, A0 and chi-squared values for the average SLD profile.
bestworstfile.txt contains the names of the files with the best and worst chi-squared values.
sldfile_00001.txt to sldfile_00225.txt contain the individual SLD profiles.
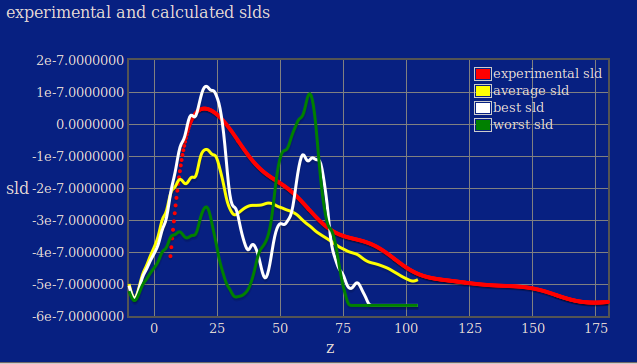
Plot of experimental SLD, average SLD, best-fit SLD and worst-fit SLD. Recall that there are only 225 structures in this test ensemble. A better match to the experimental SLD can likely be obtained with a larger starting ensemble.
input files
output files
Individual SLD files sldfile_00001.txt to sldfile_00225.txt are provided as a zip file:
There are times when it may be desirable to offset the z-position of the experimental SLD before performing any optimizations.
This example shows how to compare the average SLD to the experimental SLD using an experimental SLD offset correction of 10.0 angstroms. The experimental z-offset is taken into account when calculating chi-squared.
z0 and A0 are not optimized in this example. But, this can be easily accomplished by following Case 1 with the adjustments for the non-zero z-offset that are shown in this example.
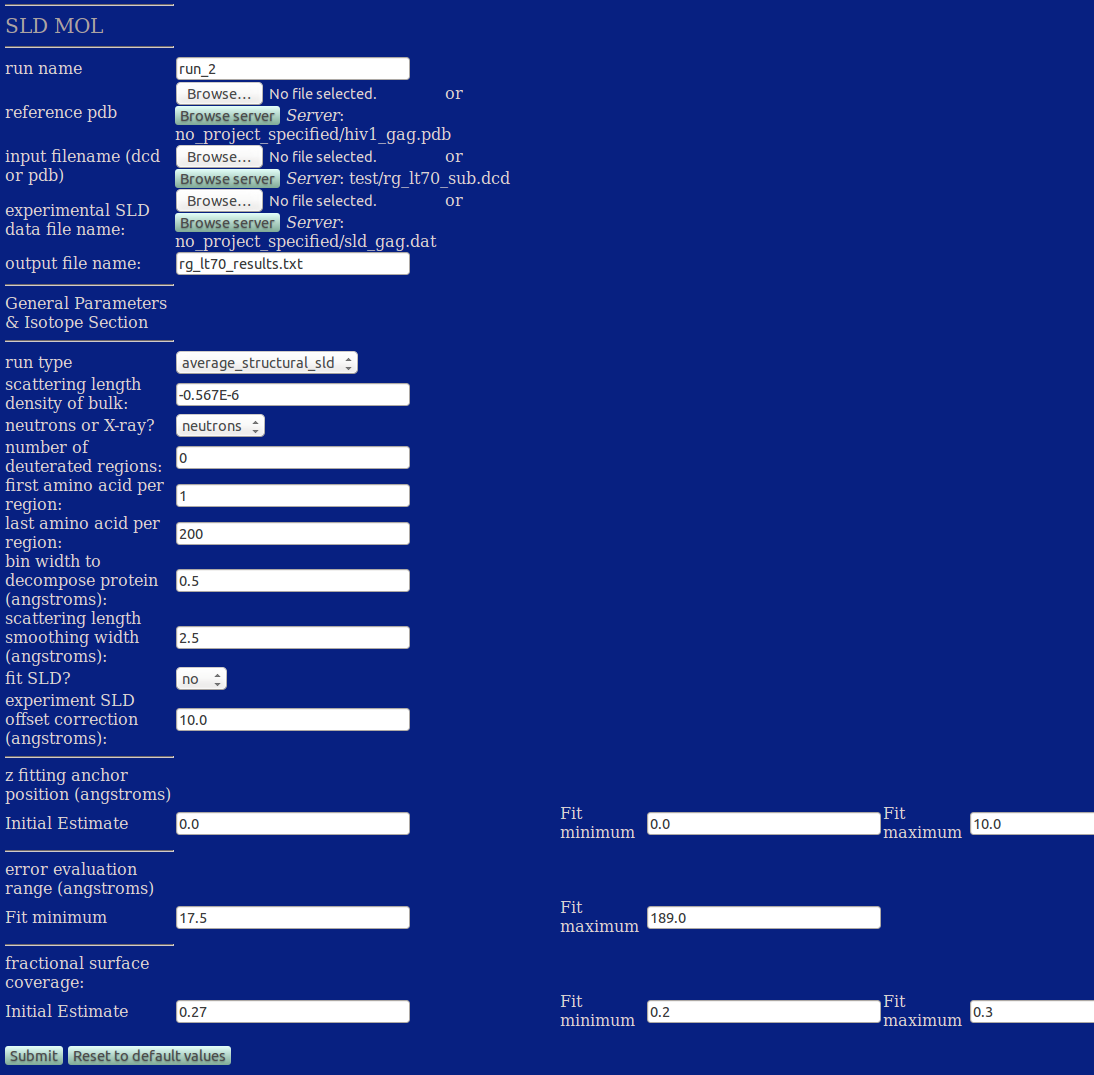
General Parameters & Isotope Section
run type Select average_structural_sld (fast) or individual_sld (slower). Average_structural_sld is selected here.
fit SLD? Yes to optimize z0 and A0; No to use initial estimates with no optimization. No is selected here.
experiment SLD offset correction (angstroms) Offset in z-direction for experimental SLD. This is useful to align the calculated and experimental SLD profiles better prior to optimization. 10.0 is entered here.
z fitting anchor position (angstroms)
error evaluation range (angstroms)
fractional surface coverage
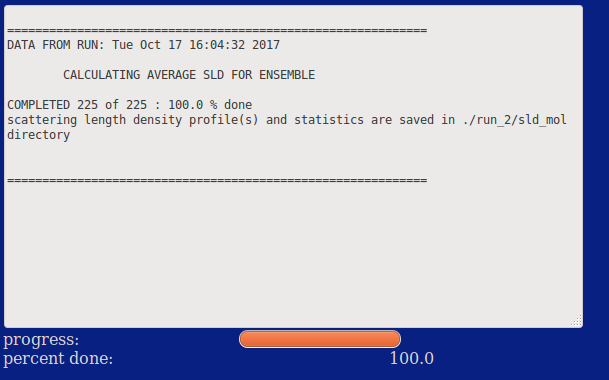
./run_2/sld_mol/average_sld.txt
./run_2/sld_mol/rg_lt70_results.txt
average_sld.txt contains the average SLD profile of the ensemble.
rg_lt70_results.txt contains the z0, A0 and chi-squared values for the average SLD profile.
Plot of experimental SLD and the average SLD. Compare this to the plot in Case 1.
IMPORTANT NOTE While the z-axis of the experimental SLD has been shifted in this plot to take the z-offset into account, the experimental SLD file is NOT rewritten with the offset z values.
input files
output files
Electrostatic interactions and binding orientation of HIV-1 matrix, studied by neutron reflectivity H. Nanda, S. A. K. Datta, F. Heinrich, A. Rein, S. Krueger, J. E. Curtis, Biophys. J. 99, 2516-2524 (2010). BIBTex EndNote Plain Text
SLDMOL: A tool for the structural characterization of thermally disordered membrane proteins
J. E. Curtis, H. Zhang, H. Nanda, Comp. Phys. Comm. 185, 3010-3015 (2014). BIBTex EndNote Plain Text