A module that implements a heuristic algorithm using maximum entropy and simulated annealing to determine plausible sub-ensemble fits to scattering data.
The Eros module is accessible from the Alpha section of the main menu.
The purpose of the module is to apply maximum entropy methods to explore viable combinations of scattering curves consistent with experimental data.
Users supply an input data file containing three columns: q, I(q), and error of I(q) at each q-value. A value of I(0), usually obtained by Gunier analysis, is required to normalize data. A path to a folder containing scattering data files, the number of files to use along with parameters to guide the fitting process.
Advanced options can be used in order to iterate the fitting process to evaluate the parameter space of the heuristic method as applied to your input data.
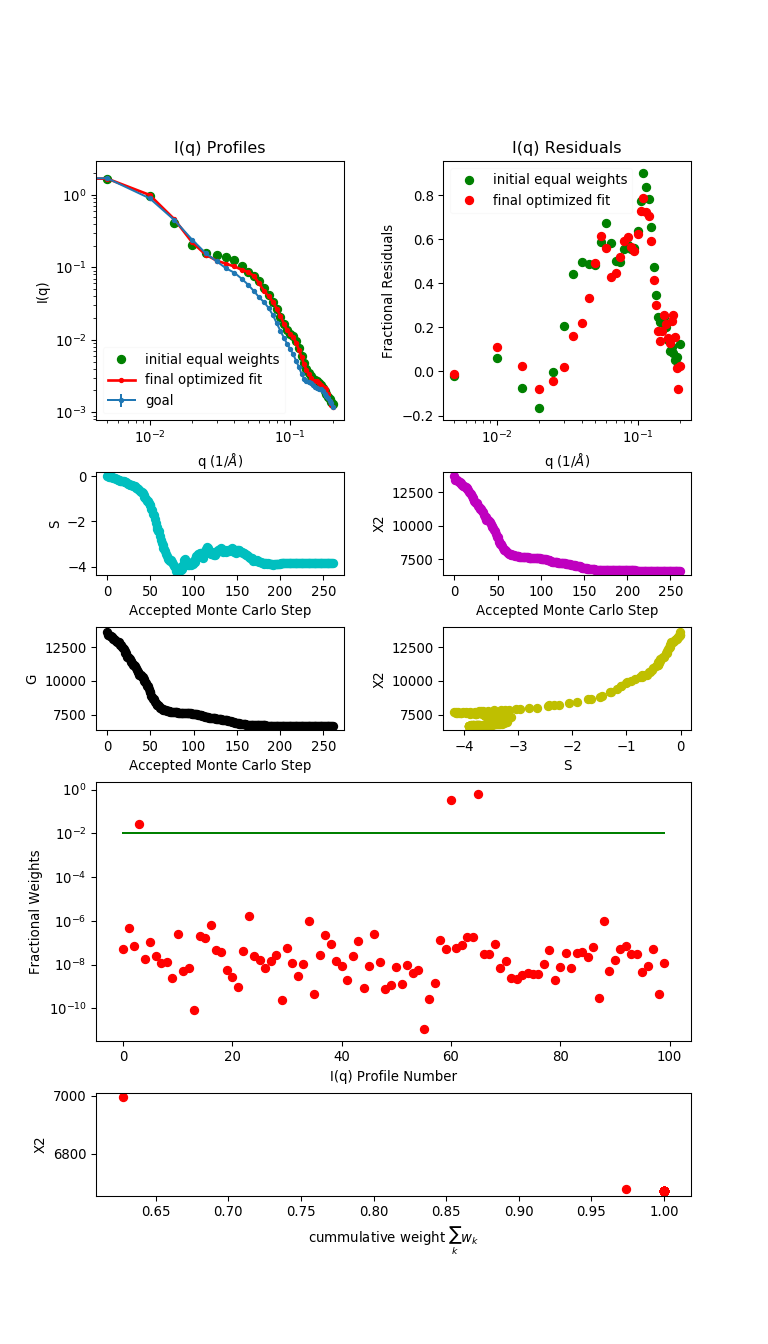
Upon completion, the module will make several plots in order to evaluate the quality of the maximum entropy fit(s).
Weight files are created that can be used by other modules to extract structures for further analysis.
The number of q-points, range of q, and the spacing of the q-points used to create the interpolated data files MUST match the input settings that you used in subsequent modules to calculate SAS profiles (Calculate) that are used in this module to compare theoretical and experimental data.
Any third-party method can be used to create the input interpolated data file but the number of q-points, range of q, and the spacing of the q-points MUST match what is used in the module used to calculate the SAS profiles.
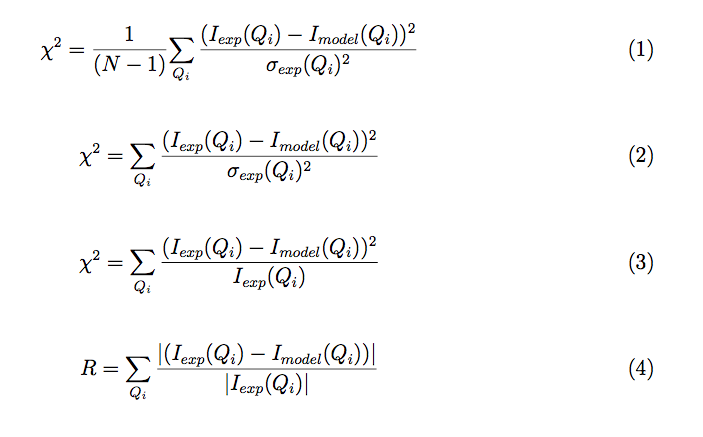
Three mathematical options are provided to evaluate the quality of the comparison. 1) reduced chi-square, 2) chi-square, 3) Pearson chi-square and 4) R-factor.
This example analyzes scattering profiles to interpolated experimental data using a set of fitting input parameters. The scattering profiles were calculated using SasCalc.
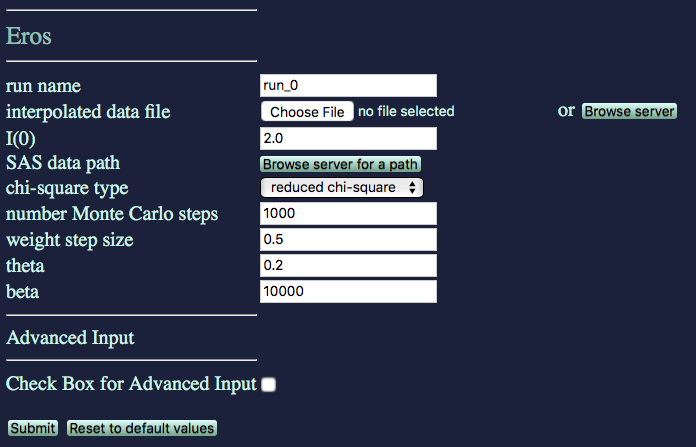
run name: user defined name of folder that will contain the results.
interpolated data file: Name of input file with interpolated data with at least three columns: q, I(q), and error in I(q)
I(0): Experimentally determined value of scattering intensity at q = 0.
SAS data path Select the directory that contains the SAS profiles.
chi-square type: Specify the quality of fit type to use in the analysis.
number Monte Carlo steps The number of re-weighting moves.
weight step size The fraction of the change in weight for each pertubation at each Monte Carlo step.
theta Temperature-like control parameter. Larger theta results in smaller pertubations of the weights. Smaller theta can result in over-fitting.
beta Boltzmann temperature parameter.

The output will show a plot of the interpolated data and scattering profiles from the best, worst, and average structures in the ensemble of scattering profiles.
Note that roll-over help will indicate options to resize, zoom and reset the view of the plot.
Results will be written to a new directory within the given "run name". For example, in the figure it is noted that the structures and dimensions were saved files within the current project directory within the chosen "run name" directory.
./run_0/eros/bestworstfile.txt
None
input file
output files
sas_spectra_plot.txt
x2_vs_rg_plot.txt
x2file.txt
averagefile.txt
bestworstfile.txt
scattering profiles are provided as a compressed archive
Simple comparison is done between theoretical and experimental data.
SAXS Ensemble Refinement of ESCRT-III CHMP3 Conformational Transitions B. Rozycki, Y. C. Kim, G. Hummer, Structure 19, 109-116 (2011). BIBTeX, EndNote, Plain Text
Numerical Recipes: The Art of Scientific Computing (3rd ed.) W. H. Press, S. A. Teukolsky, W. T. Vetterling, B. P. Flannery, New York: Cambridge University Press. ISBN 978-0-521-88068-8 (2007). BIBTeX, EndNote, Plain Text
SASSIE: A program to study intrinsically disordered biological molecules and macromolecular ensembles using experimental scattering restraints J. E. Curtis, S. Raghunandan, H. Nanda, S. Krueger, Comp. Phys. Comm. 183, 382-389 (2012). BIBTeX, EndNote, Plain Text